
BOSCH REXROTH · INDUSTRIAL HYDRAULICS · GERMANY · CASE DELIVERED

Somebody drew a line, printed it, and the numbers were gone. We read the geometry once.

Bosch Rexroth AG, in Lohr am Main, makes hydraulic valves and drive and control technology. It is a division of the Robert Bosch group and a separate legal entity from Robert Bosch GmbH. It publishes product datasheets, and on those datasheets are printed performance curves.

For a large part of that data, the printed curve is the only record. It exists nowhere in the company’s systems as numbers. Talonic screened every document in scope for its chart assets, read the printed curve geometry and delivered it numerically: 736 charts detected, about 3,300 printed curves, each one sampled to 100 points, into Excel worksheets, one per graph.

736 is the engagement’s denominator: the graphs the screening detected across the documents in scope, a subset of the customer’s larger estate. About 3,300 is approximate in the source and the tilde is the source’s own. 100 points per curve is contractual. The worksheets are delivered, countersigned on the final file bytes before they went out.

01 / ONE READ, SAMPLED TWICE · 736 GRAPHS DETECTED · 100 POINTS PER CURVE ↓

ONE PRINTED CURVE · 100 SAMPLED POINTS · SCROLL TO RE-SAMPLE

A second sampling density is a property of the capture, not an event.

Bosch Rexroth

Industrial · Germany

Industry
Industrial hydraulics
Function
Technical product data
Solution
Curve digitisation

METHOD AND PILOT ESTABLISHED · DETECTED CHARTS DELIVERED · SCALE-UP FOLLOWS APPROVAL

736 charts

from screened valve datasheets

Note: Performance and reliability data that existed only as printed curves on technical datasheets. Talonic finds each chart, reads its axes and curves, and delivers the X/Y series as tables an engineer can reuse: 736 charts, about 3,300 curves, each sampled to 100 points and checked back against the page.

THE PLATFORM RUN

  1. READ ONCE

    736

    graphs detected. Every document in scope was screened for its chart assets and each detected graph was keyed one by one on document, page and graph. 736 is the engagement’s denominator, and the documents in scope are a subset of the customer’s larger estate.

  2. STRUCTURE

    ~3,300

    printed curves structured off those 736 charts, each one sampled to 100 points. The tilde is the source’s own, and this counts curves printed on paper, per corpus.

  3. RESOLVE

    16

    decided reading conventions, applied corpus wide, under one rule: the printed label beats the drawn ink, and where they diverge the sheet says so. About one chart in five cannot be delivered without them.

  4. DELIVER

    736

    worksheets delivered, one per graph, in Excel, countersigned on the final file bytes before they went out. 736 of 736 detected graphs are built into the delivered set.

  5. QUERY FOREVER

    ONCE

    read. Every future sampling density is a projection off that one read, which makes a 500 point order a re-sample and not a re-extraction.

The fifth stage prints ONCE on purpose: it is the claim every page in this family exists to receipt.

Five stages counted in five different units, and nothing across the band is a rate, a ratio or a total. 736 charts detected by the screening, per corpus. About 3,300 printed curves, per corpus. 16 convention cards, per corpus. 736 worksheets, one per graph. Two stages print 736, and that is not a repetition: 736 charts were detected and 736 worksheets came out, one for one, because nothing here is assembled from several documents into one record. The delivery leg is complete, countersigned on the final file bytes before the work went out.

INGEST ONCE. QUERY FOREVER.

01 / one read, sampled twice

One read, sampled twice.

The performance data existed only as printed curves. Talonic read the curve geometry once. So a hundred points today and five hundred points next year are the same read, sampled twice.

For a large part of this data, the printed curve is the only record. It exists nowhere in the company’s systems as numbers. Talonic screened every document in scope for its chart assets, read the printed curve geometry and delivered it numerically: 736 charts detected, about 3,300 printed curves, each one sampled to 100 points, into Excel worksheets, one per graph.

The datasheets carry functional, performance and reliability characteristics as charts, often several complex curves on one pair of axes. The information is visible on the page. The numerical series behind it was not available in any form an engineer could reuse for analysis, modelling or a technical tool.

The hundred points on a delivered sheet are a sample taken from that capture, not the capture itself. A higher sampling density later is a re-sample of the same read, not a second digitisation of every chart. The ink is not read twice.

What the data is for: engineering analysis, modelling, and reuse in technical tools, from numbers that until now existed only as ink. Sixteen reading conventions were decided once and applied corpus wide, and every chart was re-plotted from its delivered numbers and eye-checked against the page.

The same ink, twice

100

POINTS PER CURVE

delivered · contractual

500

POINTS PER CURVE

the same read, sampled again

Two densities, one capture. 100 is the contractual density the worksheets were delivered at. 500 is the density the page argues, and it is a property of the capture rather than an event.

736 is the engagement’s denominator: the graphs the screening detected across the documents in scope, a subset of the customer’s larger estate. About 3,300 is approximate in the source and the tilde is the source’s own. 100 points per curve is contractual. The worksheets are delivered, countersigned on the final file bytes before they went out.

A second sampling density is a property of the capture, not an event.

The counts on this page are counts of work performed. Correctness was checked chart by chart in the reverse pass.

Everything below this band is the receipt for it. What the page is, how one curve is read three ways, which decided rules about one chart in five needed, how the delivery was verified backwards, and why five hundred points is the same read.

02 / the page

The datasheet is not a description of the data. It is the data.

Start with the physical fact. For a large part of this data the printed curve is the record, and it is the only one. The values exist nowhere in the company’s systems except as printed curves. There is no table behind the chart. Somebody plotted it, the page went to print, and the values behind the line stopped being values.

What that costs sits downstream. Every engineer who needs a number off that page reads it off the line by eye. The reading is redone every time, by a different person, to a different tolerance, and no two readings are the same reading.

This is a capture problem and not a search problem. A model that reads text off a page has nothing to read here. The information is in the geometry: where the ink is, what the axes say it means, and which curve is which. That has to be captured, once.

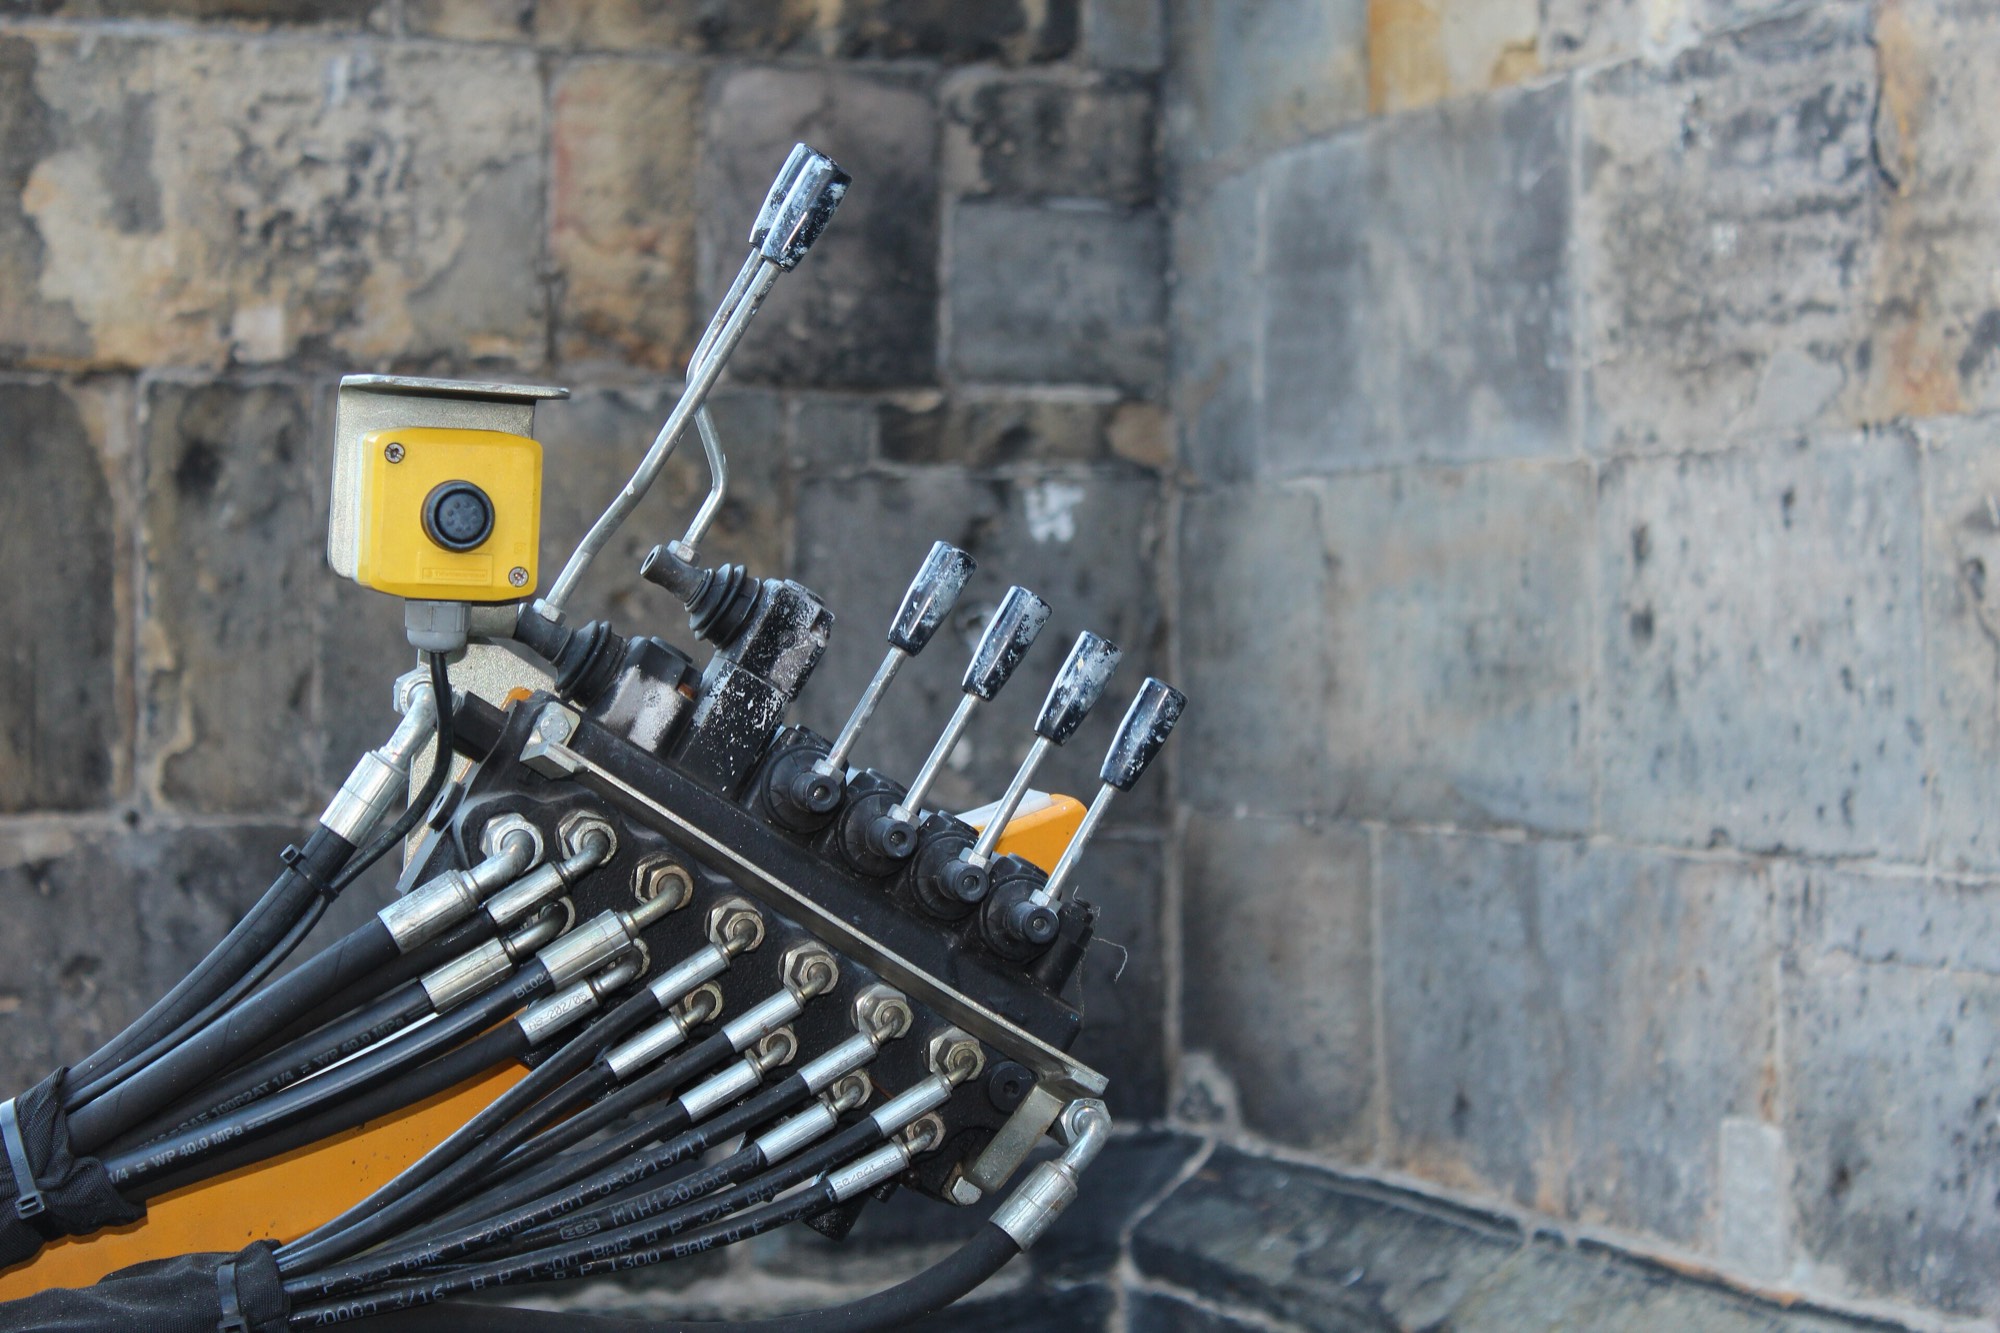
A bank of hydraulic control valves against a stone wall, spool levers above, hose fittings belowtolerance_band · 100 sampled points per curveStand-in imagery, not the customer’s product · Photo: Kleuske, CC BY-SA 3.0Stand-in imagery. Not the customer’s product.

03 / the read

Three reads of the same curve. The disagreement is the point.

01

One chart, read three ways.

Screening reads every document in scope and returns its image and chart assets. Each detected chart is then read three ways: the drawn geometry itself, the ink where the page is an image rather than a drawing, and the labels, axes and curve identity that say what the geometry means. Three reads of one chart, each produced independently of the others. When a complex image asset is detected, Talonic routes it to the appropriate vision model based on its benchmarks.

02

Agreement is the confidence signal.

Where the reads agree, that agreement is what confidence means here. Where they disagree, the chart goes to adjudication. Disagreement sends a chart to adjudication, never silently to one method’s answer, and it is never averaged into a middle value that no read produced.

03

An honest unsure range beats an invented point.

Where a read is genuinely uncertain the answer is stated as a range rather than as a manufactured value. Where a cell is off the domain of the chart it stays blank. A documented blank beats a plausible zero. This is the third independent engagement in the pack to arrive at that same finding.

Dense or hand-corrected ink gets a best-effort trace, with accuracy bounded honestly by the source resolution.

TALONIC’S OWN DELIVERY STANDARD

04 / the rules

About one chart in five cannot be delivered without a decided rule.

About one chart in five in this corpus cannot be delivered by reading it harder. It needs a decision: what a looped curve is, what a tolerance band is, where a trace stops, and what happens when a chart is printed as two panels side by side. Those decisions were made once, written down with their dates, and applied corpus wide. There are more than forty dated rulings in the ledger behind the sixteen cards below.

About one chart in five is approximate in the source. It is a judgement about difficulty rather than a measurement of it.

A plain-English reader with only the Excel and the PDF can rebuild the chart unaided. No internal vocabulary anywhere.

TALONIC’S OWN DELIVERY STANDARD

Six of the sixteen

LABELS BEAT GEOMETRY

Where a printed axis label and the traced ink disagree, the printed label wins.

the sheet records the resolved label

BLANK NOT ZERO

Off-domain cells stay blank. A documented blank beats a plausible zero.

the sheet says the cell is off the chart’s domain

ONE WALKED SEQUENCE

A looped curve is delivered as one continuous walked point sequence, with no artificial branch split.

the sheet names one curve

THE BAND IS TWO CURVES

A tolerance band is delivered as a named high curve and a named low curve beside the main curve.

three named curves, not one margin

TWO PANELS, TWO SHEETS

Twin side-by-side panels are split into two worksheets, each with its own axis.

each sheet carries its own axis and its own how-to-read note

ONE COLUMN PER SCALE

A chart printed with more than one measuring scale gets one column per printed scale.

the column header names the printed scale

Sixteen convention cards, decided in review, recorded with their dates and held in the platform as rules applied corpus wide. Six of them are shown. They are rules about charts, not about any customer’s data. About one chart in five in this corpus cannot be delivered without one.

What reaches the sheet.

Every sheet carries its own how-to-read note and a true point-count sentence. Where a curve had no printed name, the rule that numbered it is printed on the sheet. The index is regenerated from the final sheet bytes, so it mirrors every disclosure on every sheet rather than describing them. Provenance to each document source stays available.

05 / the reverse pass

The verification record is larger than the delivery.

01

Every chart was drawn again from the delivered numbers.

About 2,500 rendered images. Each chart was re-plotted from its delivered cell values and placed beside the original page crop, in two views: the curve as a line, and the delivered points as dots on their own. Each pair was eye-checked.

02

Then it was read backwards.

A second reader, independent of the one that built the workbook, went back to the printed curve geometry and compared it against the delivered curve. 3,358 curve rows, print to Excel, in the reverse direction of the work that built it.

Talonic’s own verification: an agentic pass that runs in the platform, with a reader independent of the one that built the workbook. 3,358 is the row count of that reverse re-read, a different unit from the curve count.

03

The reader had to pass a check before its verdicts counted.

Ten known defects, found by a person, were put to it first. It reproduced ten of ten. Only then were its verdicts allowed to count.

04

The countersign runs on the final file bytes.

The frozen package was re-verified as a whole before it went out: every workbook in it, every flagged chart plus a random sample of clean ones, zero deviations standing. Five structured audit rounds plus targeted class sweeps, under a rule that every finding lands as a fix, a ruling request or a disclosure, and never only in a report.

Countersigned by Talonic’s own second reader. Standing means deviations were raised and resolved.

Built one way, verified the other

A build lane running left to right from printed page to curve geometry to worksheet rows, and a verification lane running right to left through a gate node reading ten of ten known defects reproduced.BUILD DIRECTIONprinted pagecurve geometryworksheet rowsVERIFICATION DIRECTION3,358 curve rowsworksheet rowscurve geometryprinted page10 of 10known defects reproducedbefore any verdict was allowed to count
Verification runs in the reverse direction of the work that built it. This is Talonic’s own verification, agentic and run in the platform, with a reader independent of the one that built the workbook.

How a pair was checked

ILLUSTRATION · SYNTHETIC DATA · NO CUSTOMER CURVE APPEARS ON THIS PAGE

Two panels: a printed curve in grey ink with delivered sample points plotted over it, and the same points alone with no ink.CURVE VIEWdelivered points over the printed inkDOTS ONLYdelivered points on their own
About 2,500 rendered images. Every chart was re-plotted in the platform from its delivered cell values and placed beside the original page crop, in two views: the curve as a line, and the delivered points on their own. Each pair was eye-checked. The figure above is drawn from synthetic data.

The census is platform practice and it had to read zero gaps or nothing shipped. It caught real ones in flight: missing scale columns, and a missing panel. Each gap the census caught triggered a recovery wave, not a patch.

Zero census gaps is a gate that was passed. Correctness is checked separately, in the reverse pass.

06 / the resample

One hundred points today. Five hundred points is the same read.

The curve’s geometry was captured once. The hundred points on a delivered sheet are a sample taken from that capture, not the capture itself. So a request for five hundred points is a re-sample of something already read, and not a second reading of the page. The ink is not read twice.

What the site means when it says ingest once and query forever, this is the clearest case of it we have. On every other engagement, re-reading a document is expensive. Here it is not only expensive. There is nothing to re-read. The record is a printed line.

A second sampling density is a property of the capture, not an event.

One screening pass, three denominators

Screening reads every document in scope and returns its chart assets. What it returns is what is counted here, and the counts multiply as you go inward. Three different units inside one pass, drawn as containment, because a cascade would encode a rate that does not exist.

About 3,300 is the count of curves printed on paper. The 3,358 curve rows of the verification census count a different object for a different reason. The documents in scope are a subset of the customer’s larger estate.

Three different units inside one screening pass. Frame sizes are not to scale and the sequence is not a chronology. This is containment, not growth over time.

07 / next

Have data that only exists as a printed chart?

Send a datasheet, a scan, or a page out of a manual. We read the printed curve geometry and send back the numbers within five business days: one worksheet per graph, at the sampled density you name, with the reading conventions written onto the sheet. Rebuild the chart from what we send and check it against the page.

SIX CASE STUDIES: INDUSTRIAL ENERGY · GETEC / PHARMA WHOLESALE · PHOENIX PHARMAHANDEL / LOGISTICS · BRIDGEWAY / AUTOMOTIVE · MARUTI SUZUKI / RESEARCH · WZB / INDUSTRIAL HYDRAULICS · BOSCH REXROTH

THE LEDGER

Everything above this line, with its receipt.

The argument ends here. What follows is the working: every population, every date, every denominator, and the places our own account was wrong. Nothing below is needed to understand the case. All of it is needed to check it.

L1 / what we got wrong

The census had to read zero gaps. It caught real ones first.

The shipping gate was a census that had to read zero gaps or nothing shipped. Before it did, it caught real gaps in flight: missing scale columns, and a missing panel. Each one triggered a recovery wave, not a patch, under a rule that every finding lands as a fix, a ruling request or a disclosure, and never only in a report. Five structured audit rounds and targeted class sweeps ran under that rule, and the human end-to-end review, PDF against Excel against reconstruction, repeatedly set the machine gates’ agenda rather than the other way round. The reverse reader was not trusted on its own word either: ten defects found by a person were put to it first, and its verdicts counted only after it reproduced ten of ten.

About one chart in five could not be delivered by reading it harder, and the rules that delivered them were not decided once. A first round of rulings, agreed between 18 and 20 August 2026, settled looped curves, tolerance bands, ambiguous printed vertical lines, where a trace stops and twin panels. The sixteen convention cards followed on 24 August, and one question, a zero floor against negatives that are real, still had to be adjudicated per print. Sixteen cards over more than forty dated rulings: the first answer was often not the last one.

Our own account of this engagement was wrong before it was right. The first tile on this site described inspection forms, shop-floor paperwork, a field registry and an audit trail included. None of that was evidenced, and the last was contradicted by the record. Its photograph showed welders, which is the wrong industry, and the wrong image is what made the wrong story feel plausible. The first build of this page printed a heading that said the opposite of the paragraph beneath it, left the completeness receipt off every surface, and carried a count of documents that has since been struck at the founder’s direction. Each of those was caught in review. This page is the corrected version.

Every item above is Talonic’s own record of Talonic’s own work: the project ledgers of 25 August 2026 and the reviews of this page.

Every finding lands as a fix, a ruling request or a disclosure, and never only in a report.

TALONIC’S OWN DELIVERY STANDARD

L2 / the receipts

The rest of the engagement, in plain rows.

CUSTOMERBosch Rexroth AG, Lohr am Main
CORPUSproduct datasheets · one document type · mixed born-digital and scanned pages · every document in scope screened for its chart assets
GRAPHS736 charts detected · 736 of 736 built and delivered · about 3,300 printed curves · all 736 classified easy, complex or supreme
SAMPLING100 points per curve · contractual
DELIVERED ARTIFACT736 Excel worksheets · one worksheet per graph · index regenerated from the final sheet bytes
CONVENTIONS16 convention cards · 40+ dated rulings · about one chart in five needs one
VERIFICATIONabout 2,500 reconstruction pairs eye-checked · 3,358 curve rows re-read in reverse · 5 structured audit rounds · every workbook countersigned on the final bytes
PILOTa first batch run end to end before scale
STATUSdelivered · countersigned on the final file bytes before it went out

736 is the engagement’s denominator, stated four times in the source ledger, and it counts the graphs the screening detected across the documents in scope. Those documents are a subset of the customer’s larger estate. About 3,300 is approximate in the source, the tilde is the source’s own, and it counts curves printed on paper rather than the 3,358 rows of the verification census. 100 points per curve is contractual, which is the density the work was quoted against rather than an internal choice. The three difficulty classes are a triage of the corpus and not a measurement of it. The worksheets are delivered, and provenance to each document source stays available.

What we measure.

What accompanies the work is its validation record: about 2,500 reconstruction pairs eye-checked, 3,358 curve rows re-read in reverse, five structured audit rounds and a countersign on the final file bytes. Everything in the rows above counts work performed. An accuracy percentage is published only with its denominator, its date and who measured it.

L3 / withheld · WHAT STAYS WITH THE CUSTOMER

Customer values stay with the customer. Not one cell of the delivered workbooks appears here: those numbers are the thing the customer paid for, precisely because they existed nowhere else. Every curve and every point drawn on this page is synthetic.

What ships with the workbooks is the disclosure printed on each sheet, and provenance to each document source stays available.

No person is named on either side.

Commercial figures belong to the customer: price, terms and the size of the wider estate.

The engagement is told by what the screening detected and what was delivered. The count of documents screened is the customer’s number to publish.

The verification on this page is Talonic’s own, agentic and run in the platform, with a reader independent of the one that built the workbook.

SUMMARY

What this case shows

FOUR CLAIMS

Four things this engagement demonstrates, each with the figure that backs it. Every one of them is checkable against the ledger above.

  1. 01

    Printed curves became reusable data

    Performance and reliability data that existed only as datasheet curves now exists as X/Y series tables an engineer can reuse.

    736 charts · ≈3,300 curves
  2. 02

    Read, then read backwards

    The reverse pass re-plots the extracted series and checks it against the printed page, so the extraction is verified where it came from.

    Reverse pass · checked against the page
  3. 03

    Sampling density is a stated choice

    Each curve is sampled to one hundred points, a resolution stated on the page rather than implied by the data.

    100 points per curve
  4. 04

    Scale-up follows approval, not momentum

    Method and pilot are established and the detected charts delivered. The next stage is gated on approval, and the page says so.

    Pilot established · scale-up on approval
Document testresponse within 1 business day · your data back within 5

Response within 1 business day.